Research Sketches and Thoughts
Meta: building this document
This document is a mdbook project. Build and render it by:
mdbook build
# and/or
mdbook serve
For your convenience, this website is also hosted on research-sketches-and-thoughts.reify.ing and kept up to date.
Related Directions
I am still new to quantum computing, but I want to do research in quantum computing, visualization for quantum computing and develop tools for quantum software development.
- Quantum Computing (QC)
- Quantum Simulation
- Quantum Software Development (QSD)
- Quantum Machine Learning (QML)
- Agents for QC and QSD
- Visualization (Vis)
- Large Language Models (LLMs) and Agents for Vis
- Visualization for QC
Knowns and Unknowns
Quantum Computing Concepts
Walking through Quantum Computation and Quantum Information by Nielson and Chuang.
Known knowns:
- Bloch Sphere
- Qubit Math Formulation
- Basic quantum gates
Known unknowns:
- Quantum Algorithms
- Visualization techniques for quantum computing
- What is variational quantum circuits?
Quantum Computing Toolkits
Known knowns:
- Some basics of QASM
Known unknowns:
- Any concrete knowledge about any of quantum computing frameworks
Research Proposal WIP
Rough Ideas
Quantum Software Development:
- Quantum Simulator:
- I know how to write CUDA kernels
- but what are SOTA simulation algorithms? Need research 📌
- LLM agents:
- I know how to develop LLM agents
- No open benchmarks for testing LLM's understanding of quantum computing
- should make one first?
- There are techniques to train LLMs based on RL and rewards
- For a quantum code assistant, maybe we can train it with rewards from a quantum simulator
- Quantum Software Stack? 📌
- what does a quantum compiler do?
- Any other components in this stack?
Visualization with LLMs / NL2VIS:
- Personalized interactive visualization with LLMs
- Visualization Generation with Large Language Models: An Evaluation
- this is a "survey", published on Jan 2024, a bit outdated
- use Vega-Lite, a json-based DSL
- no reasoning models (like o1) examined
- reference: Chat2VIS 📌
- reference: LIDA 📌
- componentize the current algorithm-specific and generic visualization tools?
- Visualization Generation with Large Language Models: An Evaluation
- The criteria of how well a LLM did visualization seem to be a research question
- Lack of benchmarks and evals? 📌
- NL2SQL is one
- LIDA has developed some evals
- nvBench
- Eval with Multimodal capability
- RFT on visualization?
- Lack of benchmarks and evals? 📌
Visualization for quantum computing:
- Read the paper QuantumEyes ✅
- Reading the paper VIOLET 📌
- Should make a survey based on the references in QuantumEyes and VIOLET and those that refer these two papers
- Seems multi-qubit visualization is still an open research challenge / scalability of visualization
- Can VR/MR help? 📌
- Idea: Should take quantum gates as batch/broadcast operations on tensors instead of focusing on transition of every single basis state; deeply linked to tensor networks
- Idea: Quantum circuits are kind of MLPs that have complex coefficients, very similar to attention. Maybe vis on neural networks help?
- Visualization for transformers may help? 📌
- Inspired by the podcast by Lawrence Krauss and Scott Aaronson:
- Can we visualize interference of qubits? as "interference is the magic"
Quantum Machine Learning:
Autoregressive sampling (GPT-style sequential generation) has striking similarities to quantum circuits:

Goals
All together, we should develop a holistic solution for quantum software dev:
- Visualization tools for understand a quantum program
- LLM agents to:
- understand the concepts of quantum computing
- understand a quantum program with personalized visualization
- help develop new quantum algorithms
- maybe develop quantum software autonomously
- Quantum software stack, including:
- IDE with DSL server
- Debugger with visualization
- toolchains for compiling and running a quantum program:
- compiler
- simulator
- connector to physical quantum computers
Besides, an agent for visualization should generalize to Data Analytics and Visualization.
Misc
- Write a statement of research significance for NTU application
- Done, see Aims of Project Statement
- Prepare for and get a GRE test on 28th Feb 📌
Aims of Project
The Three Pillars and Their Intersections

1. Quantum Computing + LLMs
- Significance:
- Quantum computing is intrinsically complex and requires specialized knowledge, which remains a significant barrier to learning and adoption
- Quantum software development is also complex and immature in amenity
- LLMs show promise in code generation but lack quantum-specific capabilities and deep understanding
- Aims:
- Develop specialized quantum programming assistants
- Create benchmarks for evaluating LLMs' quantum understanding
- Build intelligent quantum debugging tools
2. LLMs + Visualization
- Significance:
- Current NL2VIS systems lack comprehensive evaluation frameworks
- Need for context-aware and personalized visualization systems
- Aims:
- Develop new benchmarks beyond simple Vega-Lite generation
- Create interactive, reasoning-based visualization systems, which not only generate visualizations but also provide reasoning and explanation, and even spark insights
- Build evaluation frameworks for visualization quality and effectiveness
3. Visualization + Quantum Computing
- Significance:
- Multi-qubit visualization remains a major challenge
- Need for intuitive representations of quantum algorithms
- Aims:
- Develop scalable visualization techniques for quantum systems
- Create interactive tools for quantum algorithm understanding
- Explore VR/MR approaches for quantum visualization
4. The Triple Intersection: Intelligent Visual Quantum Development
- Significance:
- Comprehensive attempt to advance quantum software development workflow
- Creates new paradigms for human-AI collaboration in quantum computing
- Aims:
- Build an integrated development environment that combines:
- LLM-powered quantum code assistance
- Intelligent visualization generation
- Interactive quantum system exploration
- Create personalized quantum learning experiences through:
- Context-aware visualizations
- Natural language explanations
- Interactive quantum simulations
- Develop evaluation frameworks that consider:
- Code quality and correctness
- Visualization effectiveness
- User understanding and learning outcomes
- Build an integrated development environment that combines:
Innovation and Impact
-
Technical Innovation
- Novel integration of cutting-edge technologies
- New approaches to quantum software development
- Advanced visualization paradigms
-
Research Impact
- Contributions to three distinct fields
- Creation of new evaluation frameworks
- Potential to accelerate quantum computing adoption
-
Practical Applications
- Enhanced quantum software development tools
- Improved quantum education and training
- Better understanding of quantum systems
Aims of Project
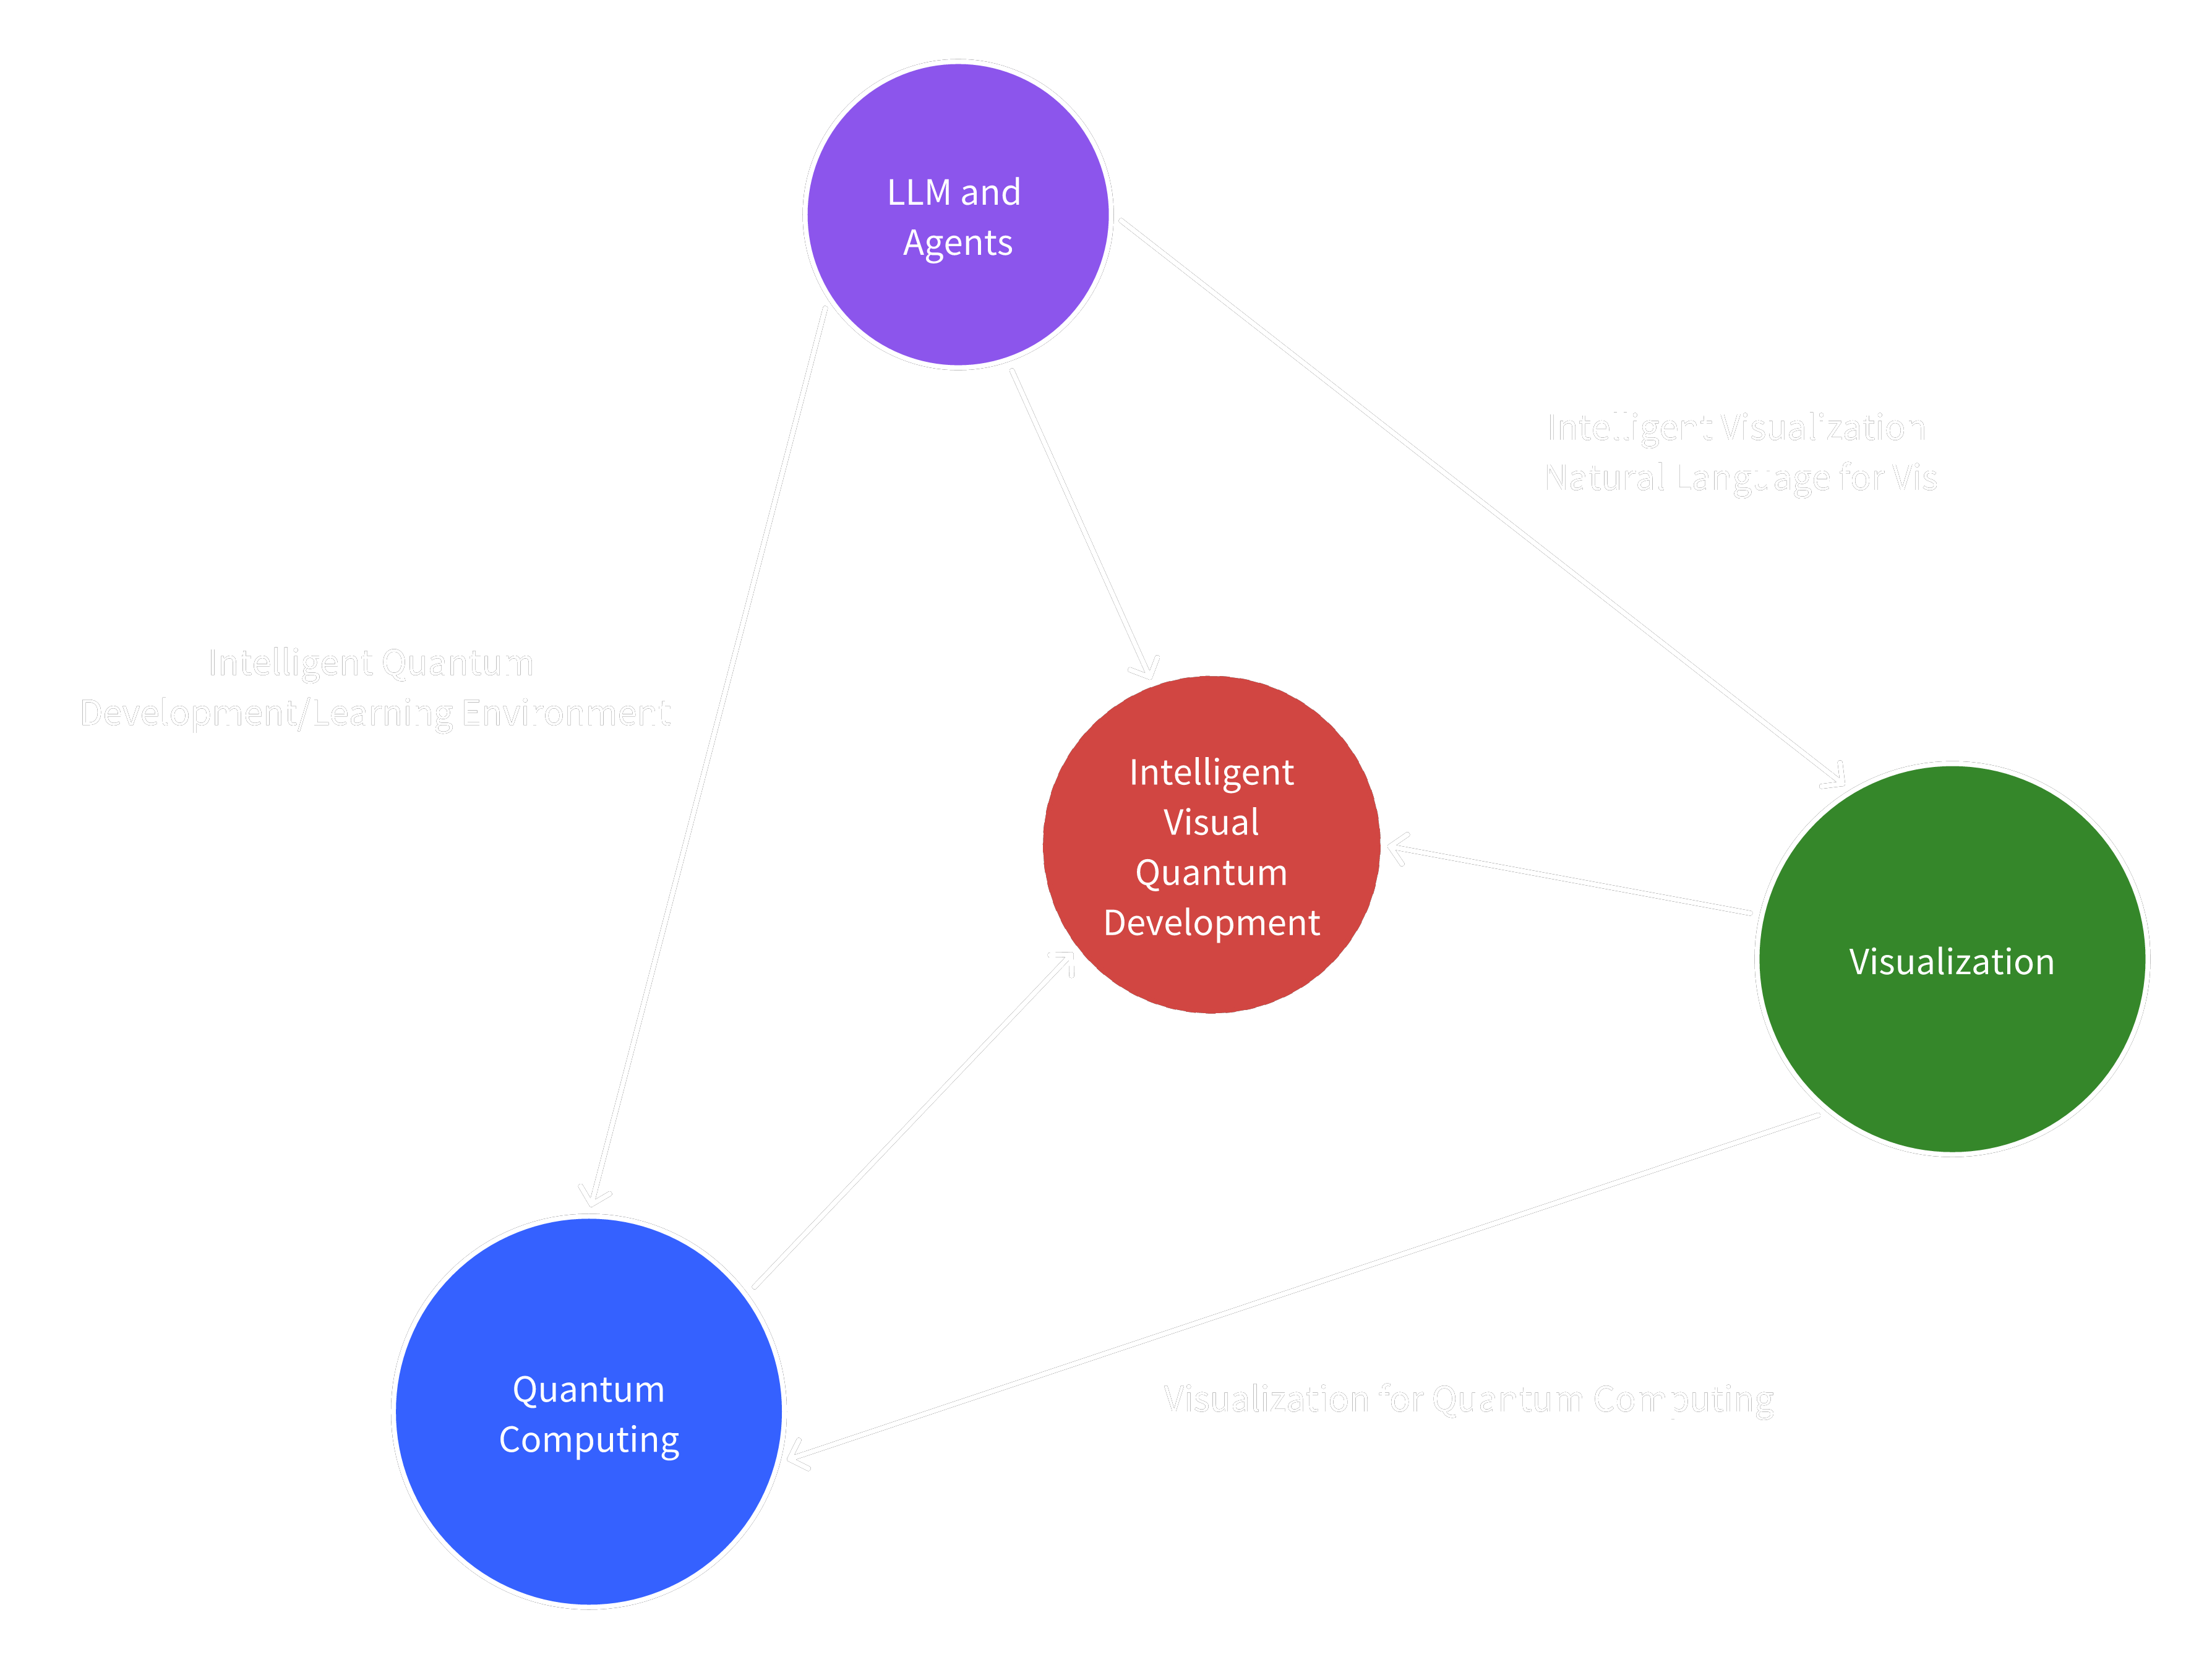
Figure 1:
The three pillars of the project are Quantum Computing, LLM and Agents, and Visualization. Valuable challenges lie in the intersections of these pillars.
Background
The intersection of quantum computing, large language models (LLMs), and visualization presents unprecedented opportunities and challenges in computer science.
Quantum computing, while promising revolutionary computational capabilities, remains largely inaccessible due to its inherent complexity and the steep learning curve associated with quantum software development.
Meanwhile, recent advances in LLMs have shown remarkable potential in natural language understanding, code generation and even reasoning. Armed with auxiliary long-term memory stores and external tools, LLM agents for programming (e.g., Devin and ChatDev) have made remarkable strides in benchmarks (e.g., SWEBench) of (classical) software development, opening the door to revolutionize development workflows.
Yet, application of LLMs and agents in quantum computing remains largely unexplored. Simple adaption of existing programming agents is not sufficient, as quantum algorithms have different operators (i.e., quantum gates and equivalent unitary operations), algorithmic building blocks (e.g., quantum Fourier transform and Glover's Search), domain-specific languages (e.g., Qiskit, QASM) and infrastructures (e.g., quantum simulators and quantum computers), which current LLM agents have not been extensively trained on and evaluated for.
Visualization, particularly in quantum computing, faces unique challenges in representing multi-qubit systems and quantum algorithms intuitively. Current NL2VIS systems lack comprehensive evaluation frameworks, and they only offers one-shot solutions that are not context-aware or personalized. However, we humans gain insights from not only visualizations but also following conversations and thereafter iterative exploration that is conversational and/or visual. There's a pressing need for visualization approaches that are more conversational, iterative and personalized.
My background in LLM agent development, scientific visualization and GPU programming, combined with the strength of Professor Yong Wang in data visualization and visualization for quantum computing and NTU's strength in quantum computing research, positions this project to address these challenges through an innovative integration of these three domains.
Aims and Significance
This research proposes a comprehensive framework that leverages the synergies between quantum computing, LLMs, and visualization to advance quantum software development and education. The project addresses three key intersections, ultimately converging on an integrated solution:
-
Quantum Computing + LLM Agents: Intelligent Quantum Development Environment
- Develop specialized quantum programming assistants that combine LLM-powered code generation with context-aware visualizations
- Create interactive debugging tools that provide natural language explanations of quantum states and operations
- Implement intelligent learning experiences and pathways for quantum computing concepts
- Develop benchmarks for evaluating LLMs' quantum understanding capabilities
-
Visualization + LLM Agents: Natural Language Visualization Interface
- Develop intelligent visualization systems that respond to natural language queries, along with composable visualization components that agents can use
- Create context-aware visualization tools that adapt to user expertise levels and even spark insights in conversations
- Implement explanation-driven visualization generation for quantum concepts
- Develop benchmarks for comprehensive evaluation of the visualization capabilities of multi-modal LLM agents
-
Visualization + Quantum Computing: Advanced Quantum Visualization
- Develop scalable visualization techniques for complex multi-qubit systems
- Create interactive visualization tools that help users understand quantum computing concepts and quantum programs
- Explore VR/MR approaches for understanding quantum systems
The convergence of these three directions leads to an Intelligent Visual Quantum Development framework that will advance how we approach quantum software development and education. This integrated solution combines:
- LLM-powered quantum code agents and learning assistants
- Natural language visualization interfaces powered by LLM agents
- Interactive quantum system exploration
- Comprehensive evaluation frameworks for both learning outcomes and system effectiveness
The project's impact extends beyond academic contributions through three key dimensions:
- Technical Innovation: Novel integration of cutting-edge technologies and new approaches to quantum software development
- Research Impact: Significant contributions to three distinct fields and creation of new evaluation frameworks
- Practical Applications: Enhanced quantum software development tools, improved quantum education and training, and better understanding of quantum systems
By combining my experience in LLM agent development with NTU's expertise in visualization and quantum computing, this research aims to create new paradigms for human-AI collaboration in quantum software development.
Status Updates and Relevant News
This lists recent status updates and some news that I think is relevant to the pillars of the project.

Status Updates
In Spring Festival, I have been busy preparing for a GRE test on 28th Feb, which is to fulfill the requirements of my NTU application. I hope I can get back to the topics that really matter, which are reviews on and surveys to quantum computing, quantum software development and visualization.
Recently I watched a podcast interviewing Scott Aaronson, a brilliant mathematician and quantum computing theorist. He mentioned that the essence of quantum computing lies in interference, which I think gives a different perspective. The interference of qubits is a bit more abstract from, say, light interference in a double slit experiment, and such interference does not manifest itself in nature. I have a feeling that "how to visualize interference" may be a good question to ask and a right one for research. This also seems more related to scientific visualization rather than data visualization.
The handover of my work is in the process at the mean time, so I still have a busy February to come.
Relevant News
- Nvidia Quantum Day in GTC 2025: For the first time, Nvidia GTC is expected to have an entire day focused on quantum computing. The date is 21st March. Checkout the link to see the interesting sessions.
- Deepseek R1 and Open R1: With Deepseek R1 and Open R1, we can soon finetune this free and open reasoning model to fit our use cases (quantum computing and personalized visualization).
- Deep Research from OpenAI: I think it's revolutionary for data analysis. It doesn't quite get to data visualization or scientific visualization yet, since it is now mostly gathering and reasoning on information based on the definite needs from users but in SciVis or DataVis, users initially may not know what they are looking for. However, I can see it will quickly (in less than a year) be capable of doing that, giving insights and visualization based on raw data and vague questions.
Status Update
- Just on 28th Feb, I have finished my work handover and taken a GRE test.
- The GRE results are 157 for the verbal section and 168 for the quant section. The score of analytical writing is still yet to come, so is the official document.
- There are a handful of new and exciting advancements in LLM agents, but I was too busy to dig into them. I think they will be useful for agents for quantum computing, so I will take a closer look at them this month and write up following updates.
- I have filled out the details of my idea regarding scalable visualization for quantum computing, which is inspired by the interesting question "how to visualize interference" and is based on confusion matrices in NLP. For details, please see the document.
- I've also added some thoughts on the operators/gates of quantum computing and simulation in Quantum Computing and Quantum Software Development.
Quantum Computing and Quantum Software Development
Quantum Operator Decomposition
Lossy: Low-Rank Approximation in Simulation
\(U\) is full-rank, but it may not be necessary to be in simulation, if some eigenvalues are very small, meaning some contributions are insignificant. \[ U \approx AB \\ U \in \mathbb{C}^{2^N \times 2^N} \\ A \in \mathbb{C}^{2^N \times M} \\ B \in \mathbb{C}^{M \times 2^N} \\ M < 2^N \]
Lossless: Broadcast
Computationally, single-qubit and two-qubit quantum gates can be expressed as broadcast tensor operations.
Relevant News
- Nvidia Quantum Day in GTC 2025: For the first time, Nvidia GTC is expected to have an entire day focused on quantum computing. The date is 21st March. Checkout the link to see the interesting sessions.
Agents for QC and QSD
Relevant News
- Deepseek R1 and Open R1: With Deepseek R1 and Open R1, we can soon finetune this free and open reasoning model to fit our use cases (quantum computing and personalized visualization).
- Deep Research from OpenAI: I think it's revolutionary for data analysis. It doesn't quite get to data visualization or scientific visualization yet, since it is now mostly gathering and reasoning on information based on the definite needs from users but in SciVis or DataVis, users initially may not know what they are looking for. However, I can see it will quickly (in less than a year) be capable of doing that, giving insights and visualization based on raw data and vague questions.
- Train your own R1 reasoning model with Unsloth: By unsloth.ai, this magically reduces VRAM requirement for post-train a model into a reasoning model from 160GB to 7-40GB. This is very helpful for turning a model with domain-specific datasets, e.g., quantum computing and/or visualization
Agents for Visualization
- Train your own R1 reasoning model with Unsloth: By unsloth.ai, this magically reduces VRAM requirement for post-train a model into a reasoning model from 160GB to 7-40GB. This is very helpful for turning a model with domain-specific datasets, e.g., quantum computing and/or visualization
When we have a transformation from one state \(x_t\) to another \(x_{t+1}\): \[ x_{t+1} = U x_t \] where \(U\) is a unitary matrix. In the case of 3 qubits, \(U\) is \([8, 8]\). \[ U = \begin{bmatrix} a_{00} & a_{01} & a_{02} & a_{03} & a_{04} & a_{05} & a_{06} & a_{07} \\ a_{10} & a_{11} & a_{12} & a_{13} & a_{14} & a_{15} & a_{16} & a_{17} \\ a_{20} & a_{21} & a_{22} & a_{23} & a_{24} & a_{25} & a_{26} & a_{27} \\ a_{30} & a_{31} & a_{32} & a_{33} & a_{34} & a_{35} & a_{36} & a_{37} \\ a_{40} & a_{41} & a_{42} & a_{43} & a_{44} & a_{45} & a_{46} & a_{47} \\ a_{50} & a_{51} & a_{52} & a_{53} & a_{54} & a_{55} & a_{56} & a_{57} \\ a_{60} & a_{61} & a_{62} & a_{63} & a_{64} & a_{65} & a_{66} & a_{67} \\ a_{70} & a_{71} & a_{72} & a_{73} & a_{74} & a_{75} & a_{76} & a_{77} \\ \end{bmatrix} \]
Quantum Interference
When we talk about quantum interference in quantum computing, what are we talking about?
My idea originates from the Double Slit Experiment. In the experiment, there are two slits. In my view, there’s one
“qubit” in the experiment. A photon can go through either one of the slits or both of them in superposition. Two base
states
|1> and |0> interfere with each other due to the phase difference that is caused by the difference of traversed
distances.

Figure 1: Double Slit Experiment
Figure from Wikipedia.
If we have 3 qubits in our quantum computer, we have 8 base states, then we have 8 conceptual slits in our experiment.
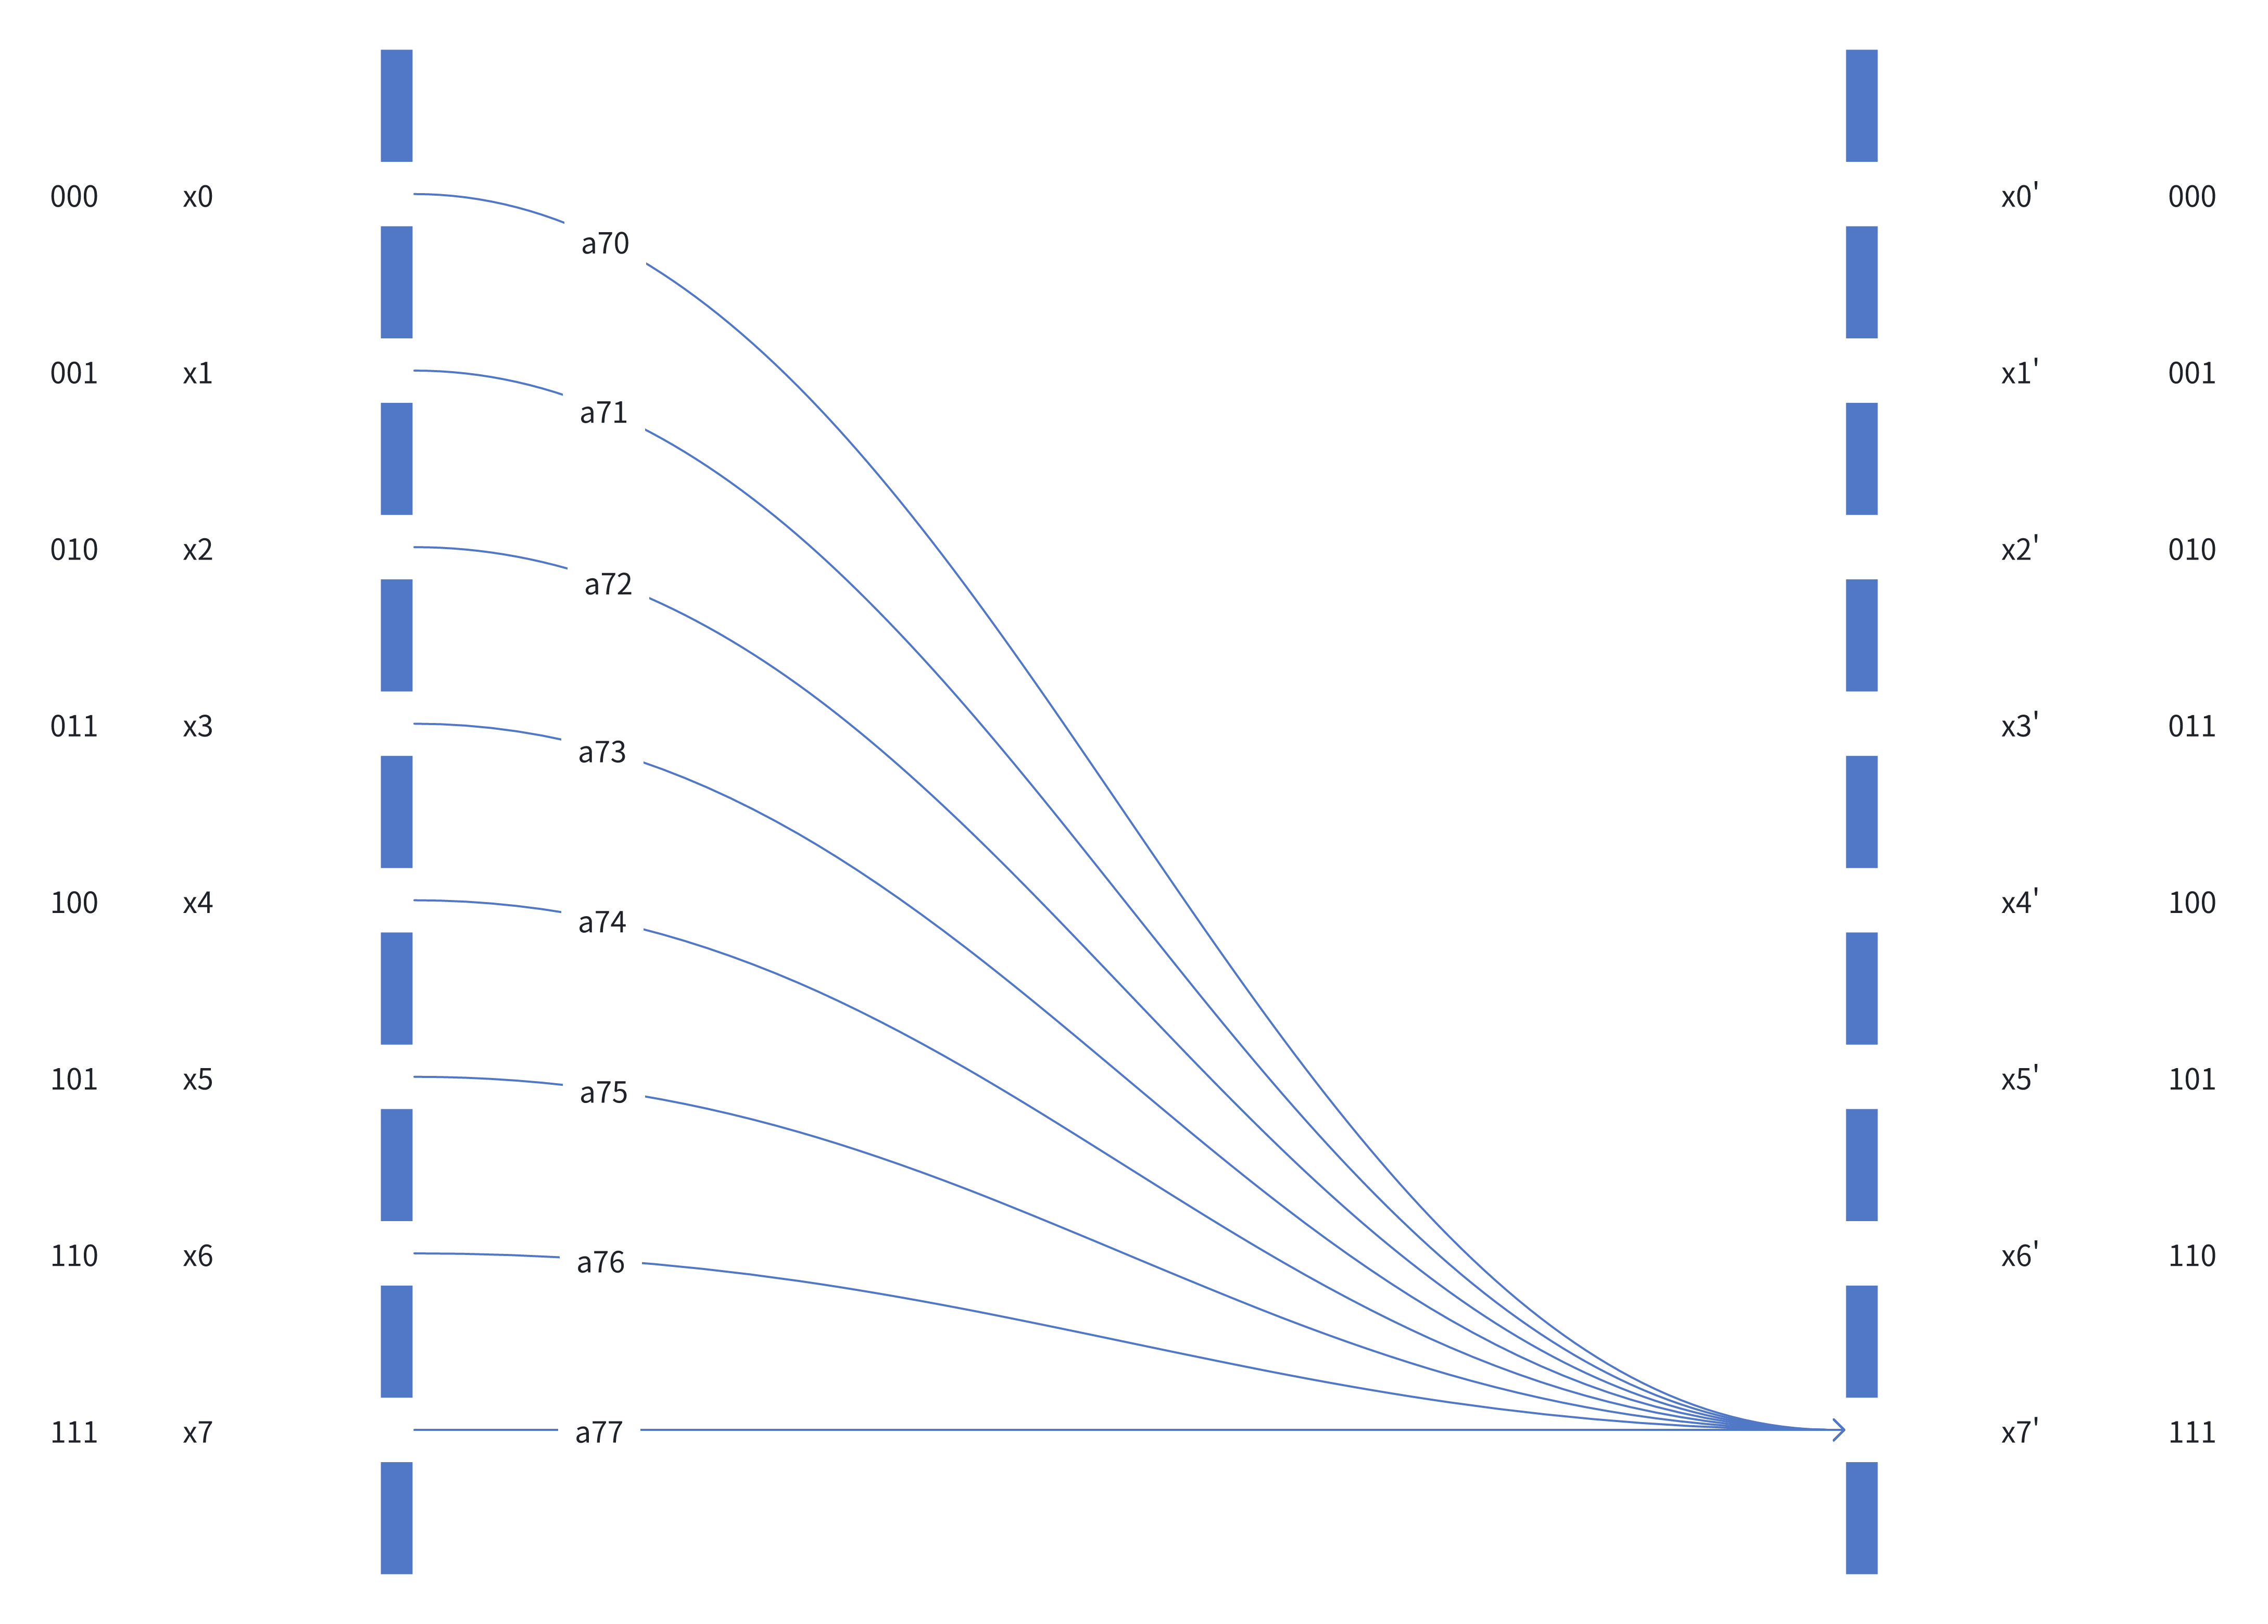
Figure 2
Conceptually, there are 8 start states and 8 end states.
The end states are discrete rather than in a continuum in the Double Slit Experiment.
For the 7th entry of \(x_{t+1}\), denoted as \(x_7'\), its value is \[ x_7' = \sum_{i=0}^7 a_{7i} x_i \]
Equation 1, in which \(a_{7i}\) is the entry (7, i) of \(U\) and \(x_i\) is the i-th entry of \(x_t\).
Phase and Amplitude in a Physical Sense
From Euler’s Formula: \[ e^{i\theta} = cos\theta + sin\theta i \] any complex number \(y\) can be represented as \[ y = Ae^{i\theta} = a + bi \\ A = \sqrt{a^2+b^2} \\ a,b,\theta \in \mathbb{R} \] where \(A\) is the amplitude of \(y\).
So, for \(y_1, y_2 \in \mathbb{C}\) \[ y_1\cdot y_2 = A_1 A_2\ e^{(\theta_1 + \theta_2) i} \] where \(\theta_1 + \theta_2\) is the change in phase, \(A_1 A_2\) in amplitude.
So, in the Equation 1, \(a_{7i} x_i\) describes how each of the base states changes in terms of phase and amplitude, with respect to \(x_7'\), as demonstrated by each curved line in the figure.
Take \(a_{70}x_{0}\) as an example, in physical sense, it means how the amplitude and phase will change when the base
state |000> “traverses” through the “environment” and reaches the base state |111>. The “environment” is defined
by \(U\).
Interference with a Vector Interpretation
A complex number is a vector in the complex plane. With this interpretation, multiplication of two complex numbers is the actions of stretching (i.e., amplitude change) and rotation (i.e., phase change).
So, each term in the Equation 1, \(a_{7i} x_i\) , is stretching and rotating \(x_i\) by \(a_{7i}\), yielding a new vector.
Let’s denote \(a_{7i} x_i\) as \(v_i\). \[ x_7' = \sum_{i=0}^7 a_{7i} * x_i = \sum_{i=0}^7 v_i \]
Graphically we have

To measure the contribution of each \(v_i\) to \(x_7'\), we can do projection like done by real-valued vector product.
Suppose: \[ x_7' = (a, b) \\ v_7 = (k, j) \] the contribution of \(v_7\) is \[ c_7 = \frac{ak + bj}{\sqrt{a^2 + b^2}} \] The illustration is shown below:

In this case, \(c_7\) is a negative number, meaning the base state |111> at \(t\), after traversing through the
“environment” defined by \(U\), negatively impacts the probability / amplitude of base state |111> at \(t+1\).
Visualization
With this contribution measure, we can define a function to calculate all the contributions likewise, giving a contribution matrix \(C\).
\[ C = f(U, x_i) \]
\[ C = \begin{bmatrix} c_{00} & c_{01} & c_{02} & c_{03} & c_{04} & c_{05} & c_{06} & c_{07} \\ c_{10} & c_{11} & c_{12} & c_{13} & c_{14} & c_{15} & c_{16} & c_{17} \\ c_{20} & c_{21} & c_{22} & c_{23} & c_{24} & c_{25} & c_{26} & c_{27} \\ c_{30} & c_{31} & c_{32} & c_{33} & c_{34} & c_{35} & c_{36} & c_{37} \\ c_{40} & c_{41} & c_{42} & c_{43} & c_{44} & c_{45} & c_{46} & c_{47} \\ c_{50} & c_{51} & c_{52} & c_{53} & c_{54} & c_{55} & c_{56} & c_{57} \\ c_{60} & c_{61} & c_{62} & c_{63} & c_{64} & c_{65} & c_{66} & c_{67} \\ c_{70} & c_{71} & c_{72} & c_{73} & c_{74} & c_{75} & c_{76} & c_{77} \\ \end{bmatrix} \]
\[ x_j' = \sum_{k} i_{jk} * x_k = \sum_{k} v_{jk} = m + ni \\ v_{jk} = a + bi \\ c_{jk} = \frac{am + nb}{\sqrt{m^2 + n^2}} \]
This matrix can be visualized like confusion matrices.
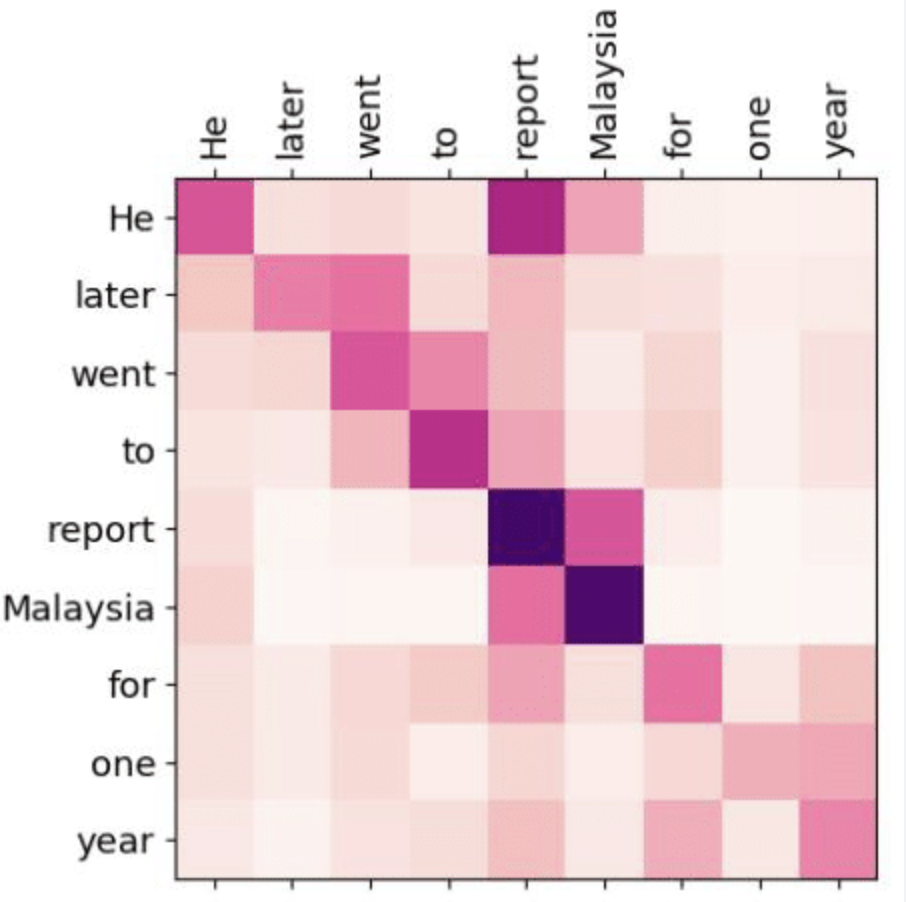
Figure 3: An example of confusion matrices in the context of NLP
Such visualization can be applied similarly to \(C\), where the color scheme illustrates the sign and magnitude of contribution of each entry.
For a base state to stand out, the corresponding row of \(C\) should be almost of the same color (contributions); if the corresponding row of \(C\) is full of different colors, the contributions to a base state cancel out.
Figure 2 can also be enhanced if the color of a line indicates contribution.
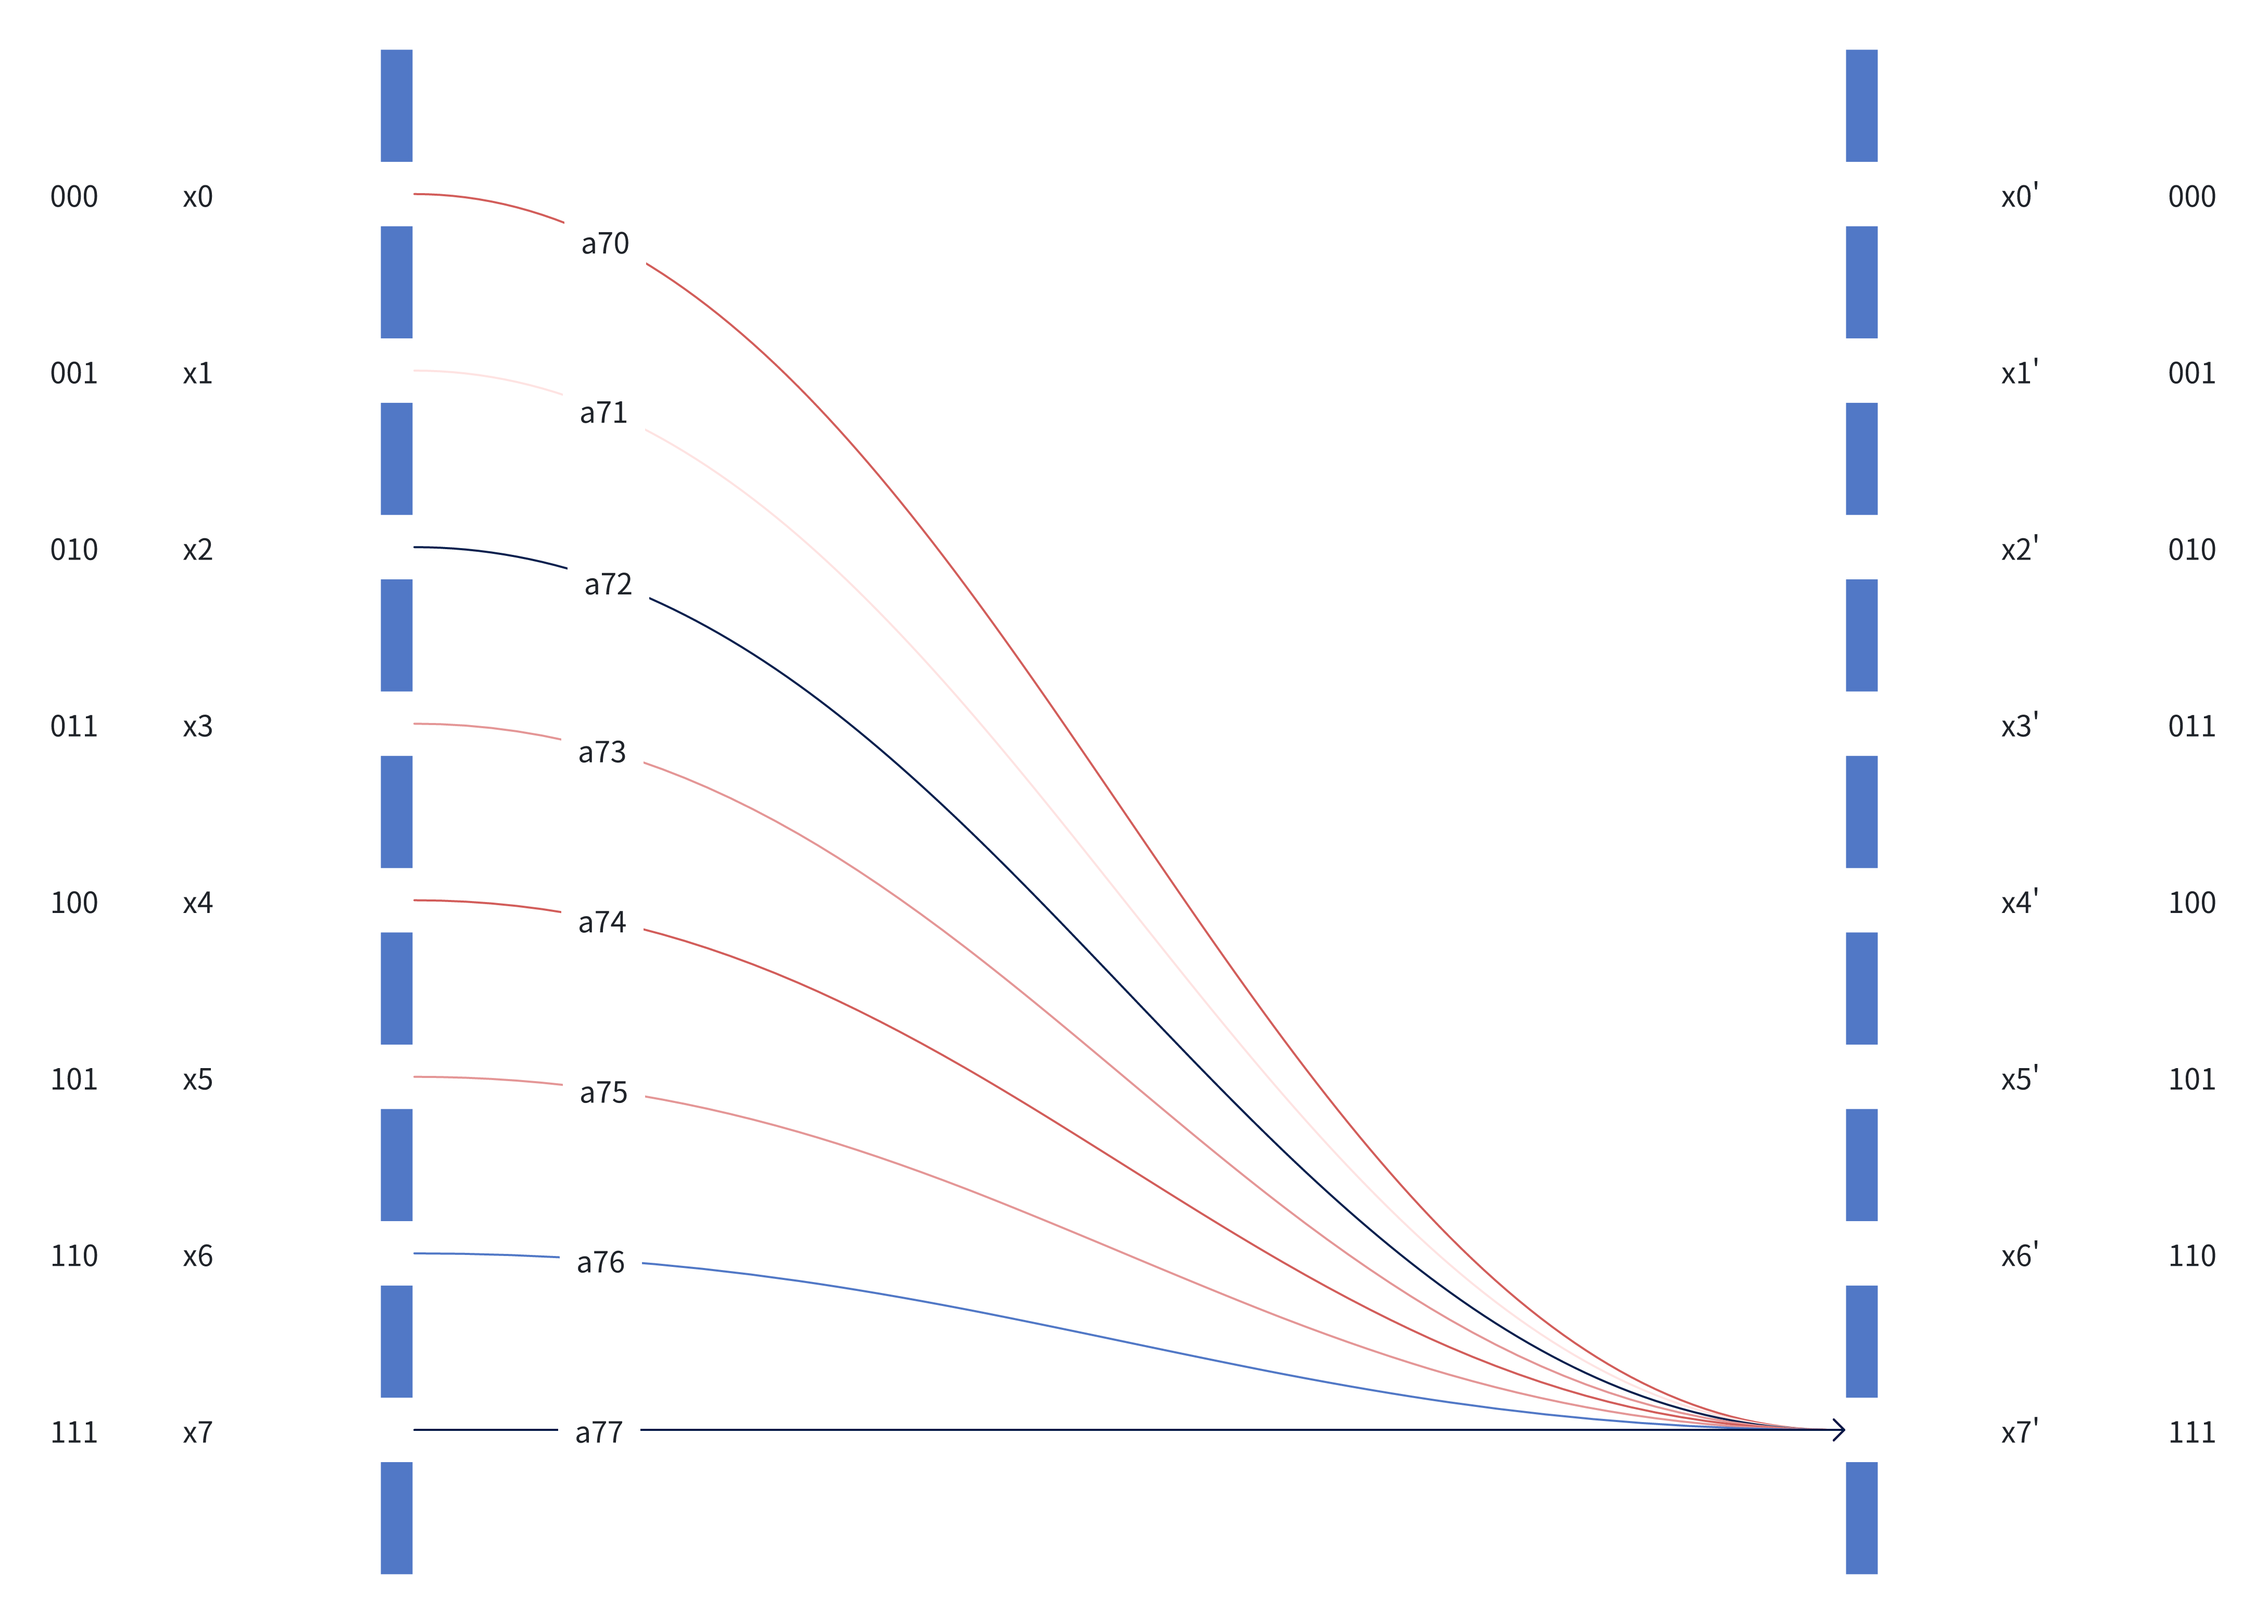
Figure 4: Figure 2 enhanced with a color scheme
Red: Positive Contribution
Blue: Negative Contribution
Scalability
Such visualization of \(C\) can be easily scaled to 10-qubit systems, in which \(C\) is a 1024x1024 matrix that can be displayed on a modern monitor.
We can group base states by grouping qubits and summing their respective contributions. For example, we can group qubits as qubytes, then the visualization scale is reduced by 256 times. This is equivalent to binary subdividing \(C\) into submatrices and then summing up their entries.
For example, if we group the last \(k=2\) of 3 qubits, the expanded view of \(C\) is like below:
\[ C = \begin{bmatrix} \begin{bmatrix} c_{00} & c_{01} & c_{02} & c_{03} \\ c_{10} & c_{11} & c_{12} & c_{13} \\ c_{20} & c_{21} & c_{22} & c_{23} \\ c_{30} & c_{31} & c_{32} & c_{33} \\ \end{bmatrix} & \begin{bmatrix} c_{04} & c_{05} & c_{06} & c_{07} \\ c_{14} & c_{15} & c_{16} & c_{17} \\ c_{24} & c_{25} & c_{26} & c_{27} \\ c_{34} & c_{35} & c_{36} & c_{37} \\ \end{bmatrix} \\ \begin{bmatrix} c_{40} & c_{41} & c_{42} & c_{43} \\ c_{50} & c_{51} & c_{52} & c_{53} \\ c_{60} & c_{61} & c_{62} & c_{63} \\ c_{70} & c_{71} & c_{72} & c_{73} \\ \end{bmatrix} & \begin{bmatrix} c_{44} & c_{45} & c_{46} & c_{47} \\ c_{54} & c_{55} & c_{56} & c_{57} \\ c_{64} & c_{65} & c_{66} & c_{67} \\ c_{74} & c_{75} & c_{76} & c_{77} \\ \end{bmatrix} \end{bmatrix} \]
The compressed view of \(C\) has only 4 entries, so the compress ratio is 16 (\(=2^k\times 2^k\)) times (from 64 to 4).
Such visualization can scale to (10+8) qubit systems by grouping by qubytes. With hierarchical grouping, the visualization can also scale beyond (10+8) qubit systems.